Overview
The analytics service (KAS) provides a TRE operator with analytics support to record and analyse infrastructure usage and performance metrics across a deployment. Built on underlying components (e.g. Prometheus, Grafana, Kube-State-Metrics) provisioned through the kube-prometheus-stack helm chart, KAS includes additional capabilities to capture and monitor workspace usage and through the integration of Thanos, provides operators with options to configure high-availability access to usage metrics through persistent storage.
KAS aims to address the following TRE analytics and usage monitoring requirements outlined in the SATRE specification:
- 2.2.14 - A TRE must record usage data (Mandatory)
- Number of users
- Number of projects
- Volume of data storage
- Workspace counts
- 2.2.15 - A TRE should record which datasets are accessed, when and by who (Recommended)
- Help to maintain auditability of how sensitive data has been used
- 2.2.16 - A TRE should record computational resource usage at the user or aggregate level (Recommended)
- Useful for optimising the allocation of resources, and managing costs
- Usage monitoring and reporting is supported for both k8s components (i.e. pods, containers) and application-level resources (i.e. workspaces).
Architecture & Integration
The analytics service design relies on a set of FluxCD kustomizations to define the deployment of key components (i.e. prometheus, grafana) and custom resource metric overlays to provision the service within an instance. TRE operators can choose to integrate this service as part of an instance deployment by including a reference to its git repository in the central helm configuration and flux configuration repositories that control your deployment settings. Specifically, in the helm configuration repository for the instance, edit the values.yaml file similar to:
  observability_metrics:
	state: "enabled"
	namespace: observability-metrics
	chart_version: ""
	repository:
  	name: observability-metrics
  	url: https://github.com/lsc-sde/iac-flux-observability-metrics
  	branch: main
  	requiresAuth: false
  	secret:
    	usernameKey: ""
    	passwordKey: ""
In the central flux configuration, the core/flux-config.yaml definition should include the following reference under the components list:
 observability_metrics:
   repository:
     branch: release/0.1.42
These configurations inform the fluxCD controllers running in your target cluster where to pull the microservice codebase in github along with the specific release branch to use.
The solution’s observability metrics service uses prometheus that polls and scraps metrics from infrastructure components and custom resources via the metrics-server and kube-state-metrics (KSM) agents. These agents listen on the control plane for object state changes and generate relevant metrics that are stored in prometheus. The solution’s metrics service includes modifications to the kube-state-metrics agent to additionally generate metrics related to the solutions workspace and workspace user binding objects. Current custom metrics provide real-time information on the state of TRE workspaces and users to generate higher order analytics that are provided through Grafana. For developers looking to extend metric creation capabilities, more information on how to define “CustomResourceStateMetrics” objects can be found here.
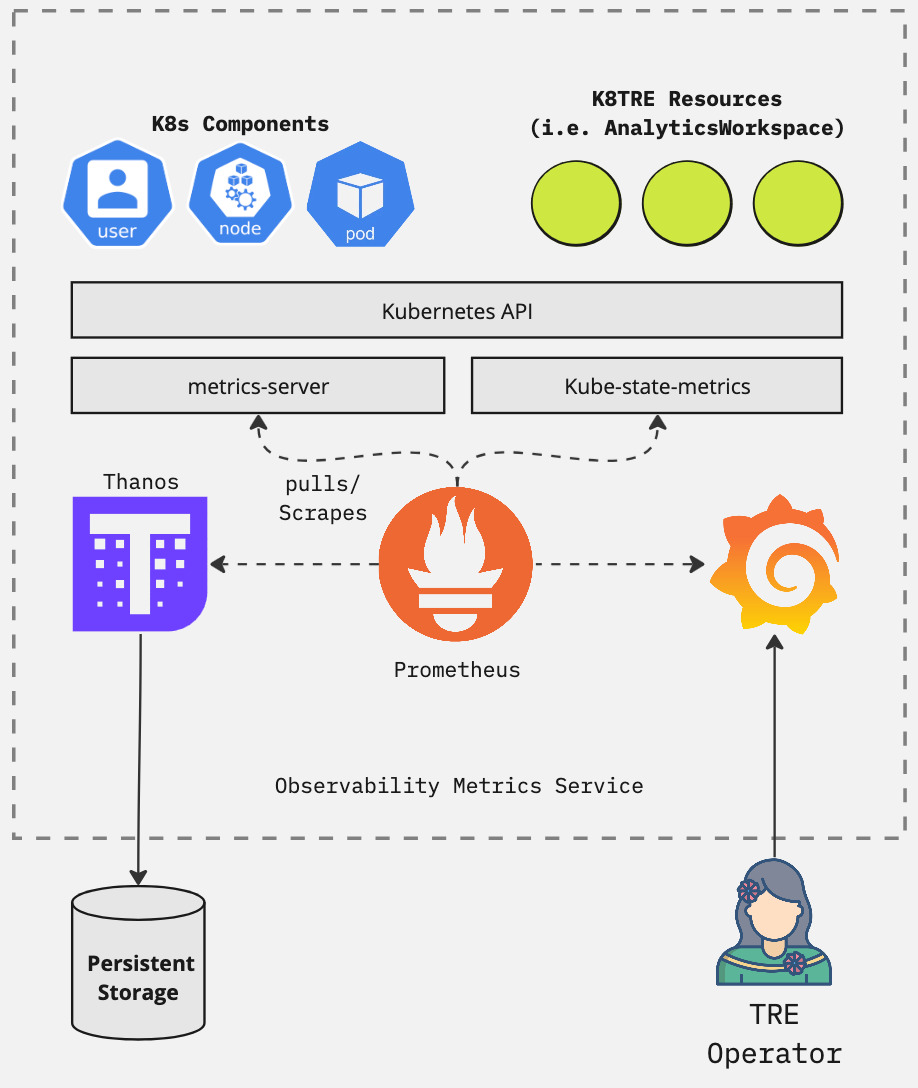
Grafana is configured to integrate prometheus as a data source and includes a number of out-of-the-box monitoring dashboards.
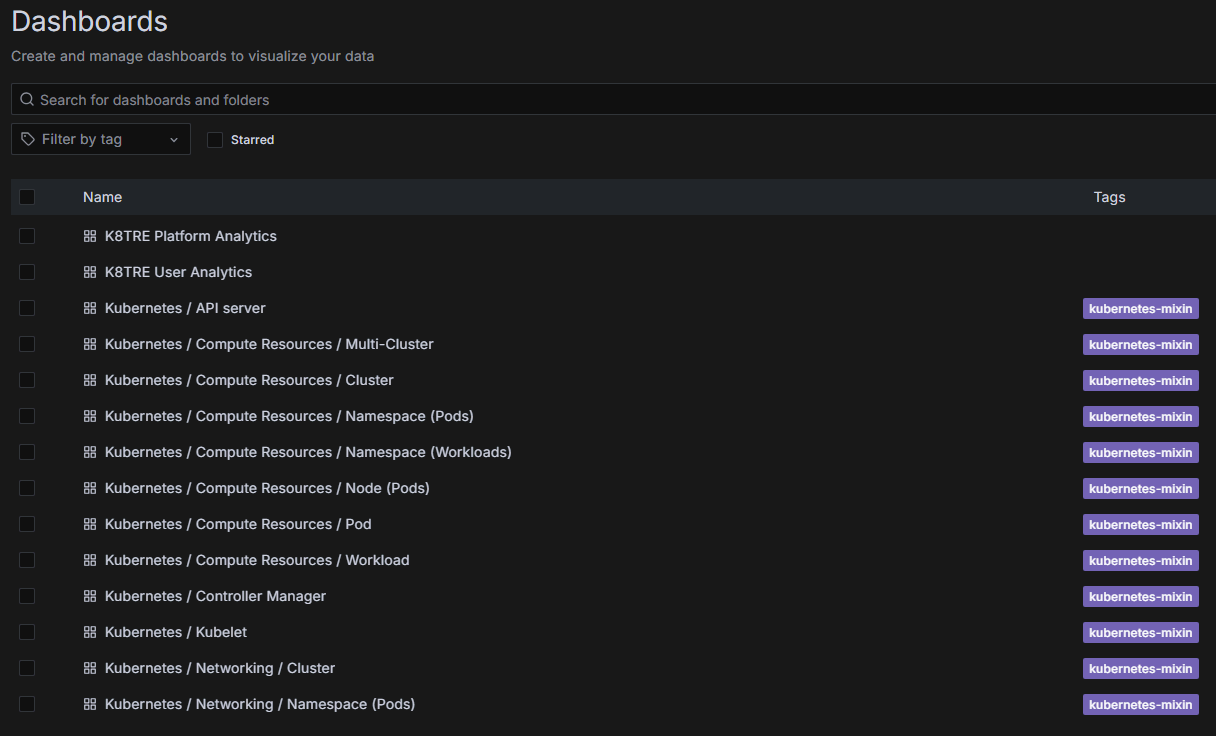
In addition, this service includes two solution specific dashboards (Solution Platform and User Analytics shown below) that provide TRE operators with SATRE-compliant usage metrics.
Persistent Storage
To provide long-term persistent storage of infrastructure metrics the analytics service integrates with Thanos that adds unlimited retention capabilities to prometheus. Thanos runs as a container sidecar along with prometheus to periodically sync database snapshots to a specified external data store. The current implementation defaults to using an Azure blob storage account. However, developers can configure access to other Thanos supported object stores by modifying the prom-environment-config.yaml file in the metrics service git repository.
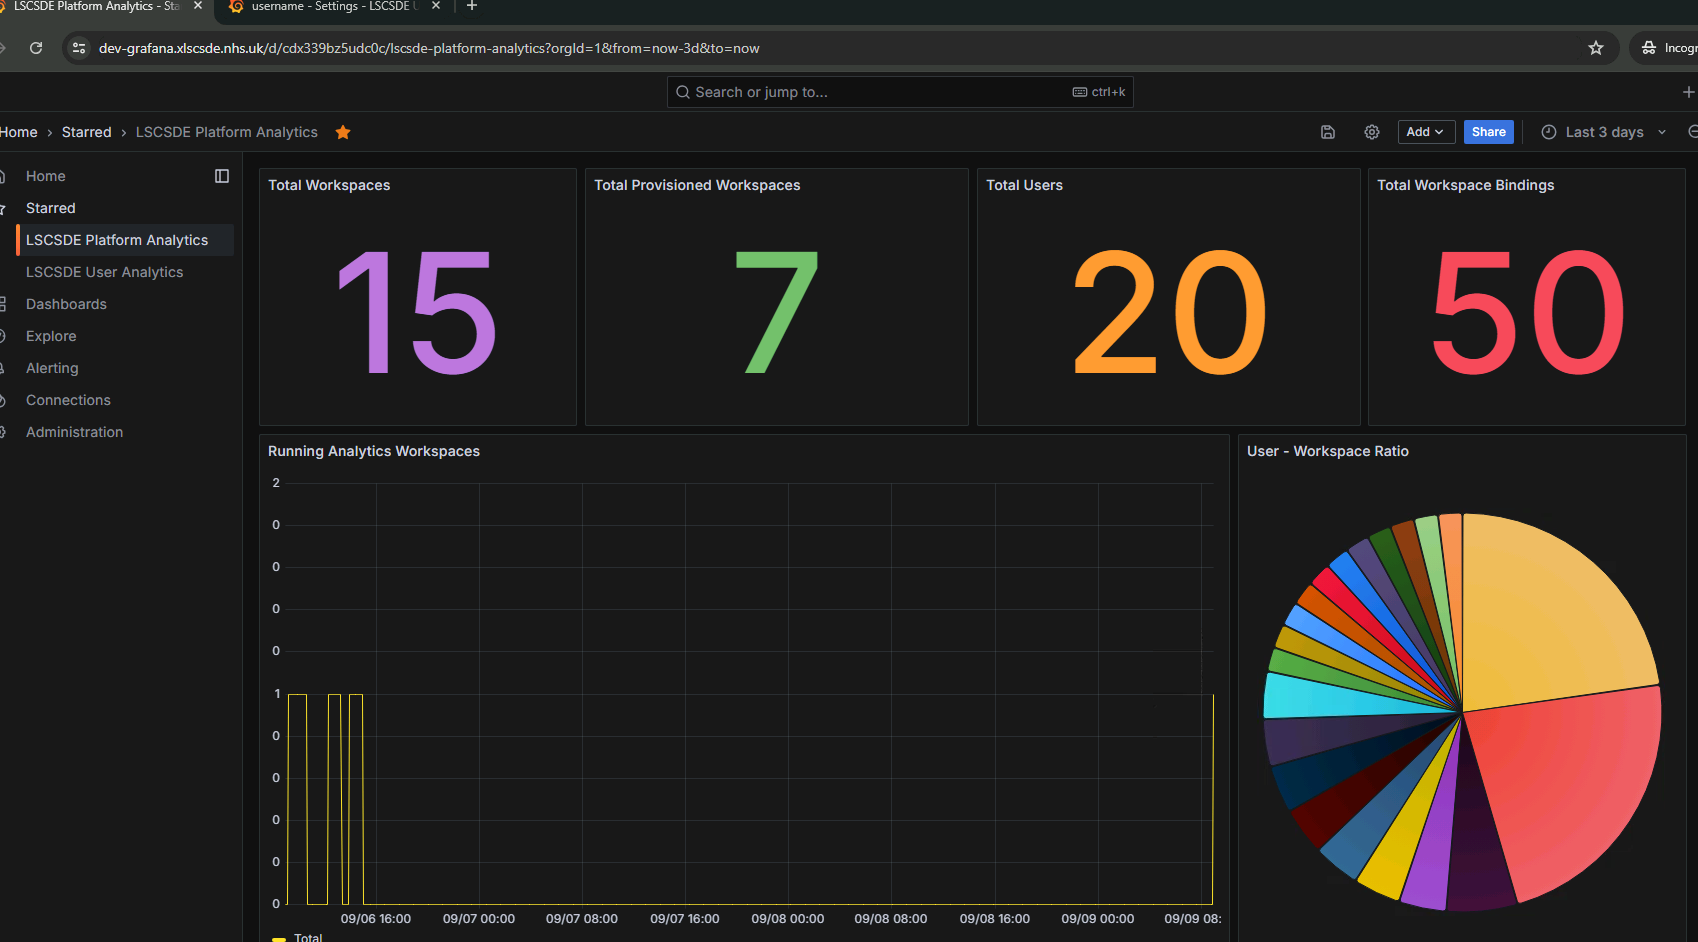
Platform Analytics
The solution dashboard displays real-time usage metrics that include:
- Total created of workspaces
- Total provisioned workspaces
- Total number of users
- Total number of workspace user bindings
- Number of active/running workspaces over time
- User to Workspace ratio
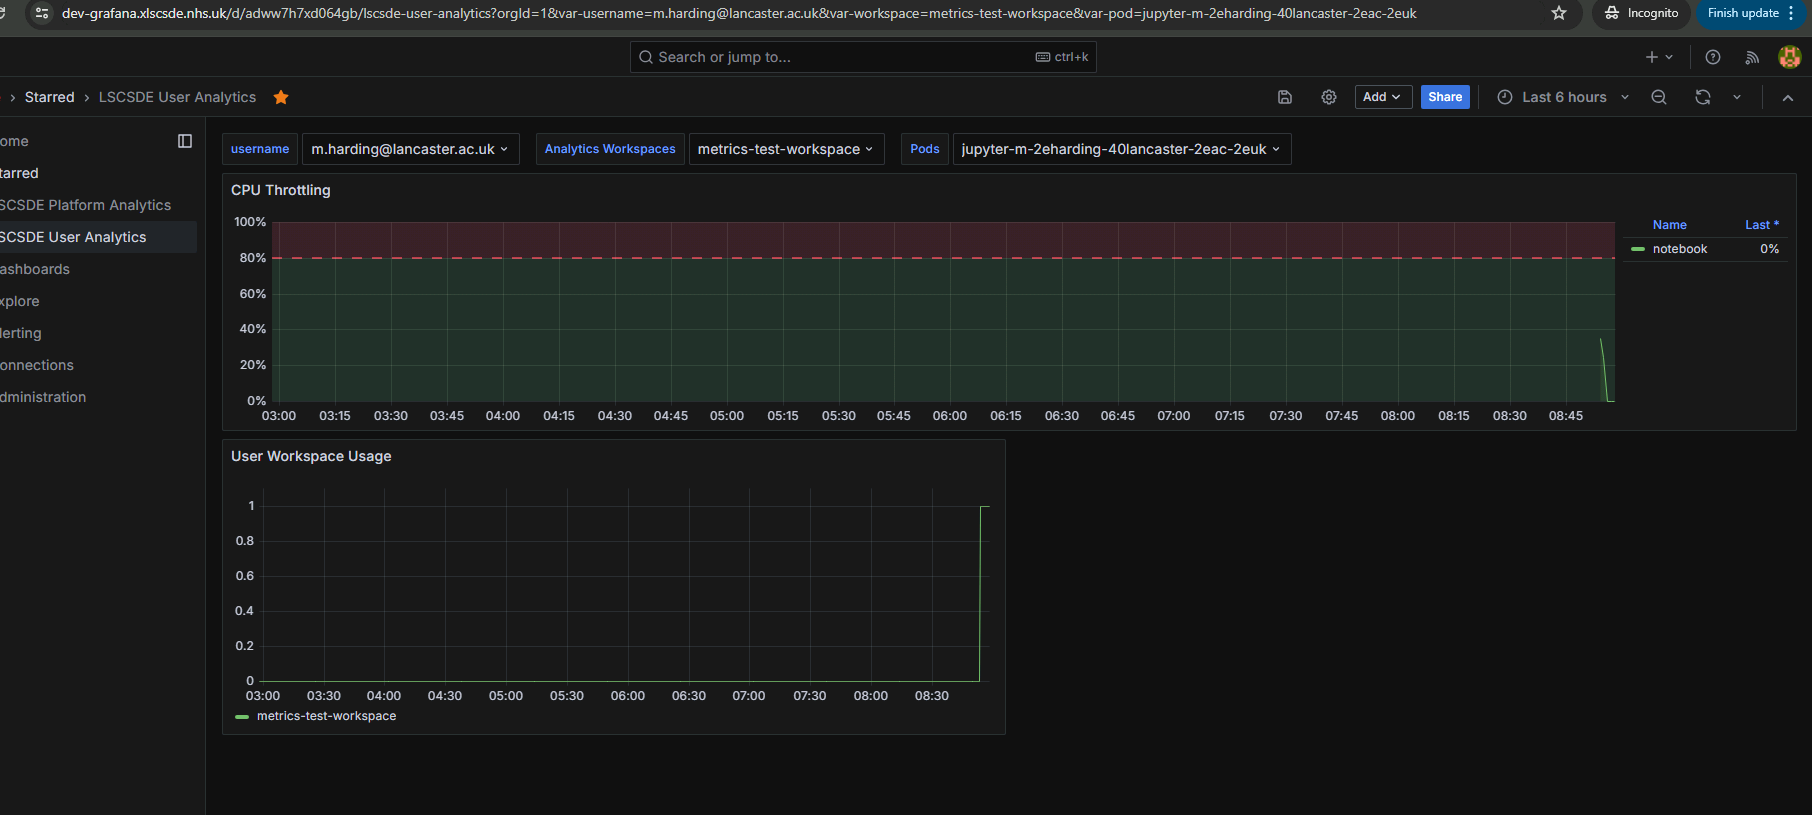
User Analytics
Operators can view computational resource usage by applying user and/or workspace filters. The user analytics dashboard currently shows CPU consumption based on individual workspaces and aggregates to an specific user.
UI Access
Grafana and prometheus admin portals are accessible through URLs that follow the naming convention below. For developers, these can be changed in the KAS ingress definitions here.
- Grafana
${environment_dns_prefix}grafana${environment_dns_suffix}.${private_dnz_zone}(e.g. https://dev-grafana.xlscsde.nhs.uk)
- Prometheus
${environment_dns_prefix}prometheus${environment_dns_suffix}.${private_dnz_zone}(e.g. https://dev-grafana.xlscsde.nhs.uk)